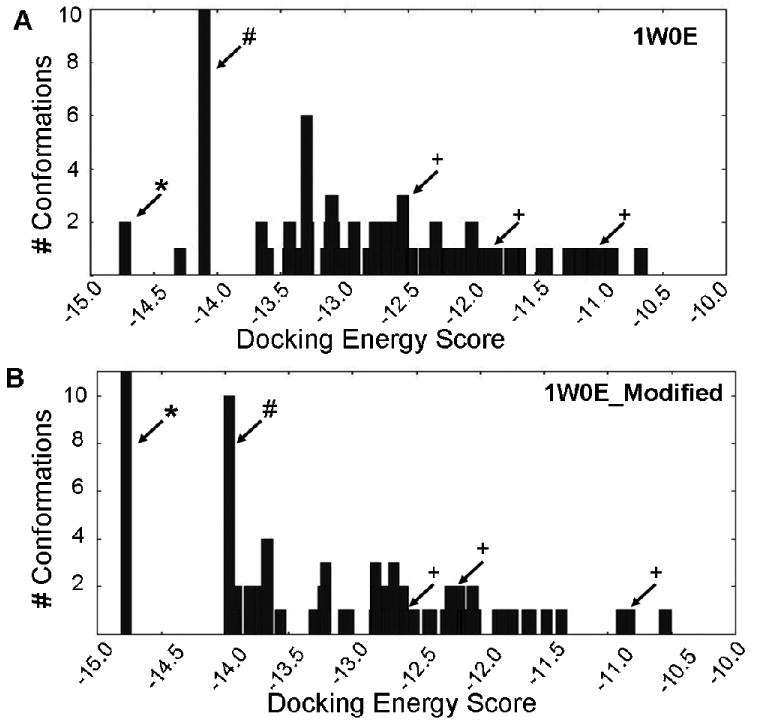
Figure 1.

Histograms of energy clusters of 100 conformations generated by docking raloxifene into (A) 1W0E and (B) 1W0E_Modified using AutoDock 3.0. Conformations generated by AutoDock were clustered at RMSD = 2 Å, and then plotted by the lowest energy conformation of each cluster. (*) indicates most abundant/lowest energy cluster predicting raloxifene dehydrogenation. (#) indicates largest cluster that predicts “inactive” conformations. (+) indicates conformation that predicts 3′ hydroxylation of raloxifene.
