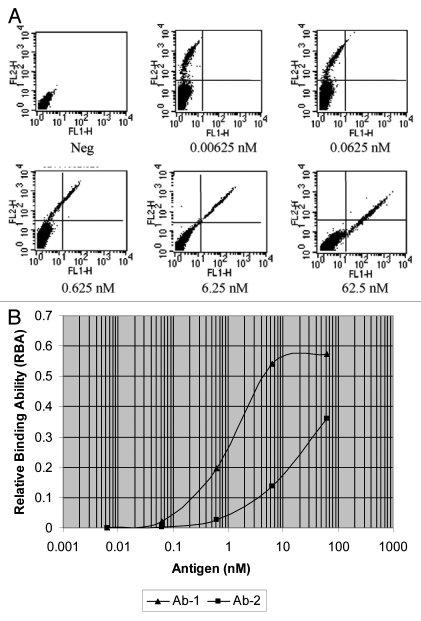
Figure 5.
Characteristics of antibody display on cell surface. FCHO cells stably transfected with antibody display vectors directing the surface expression of antibodies were co-stained with PE-conjugated anti-kappa chain antibody and FITC-conjugated antigen and then analyzed by flow cytometry. The concentration of anti-kappa chain antibody was fixed and the concentration of the antigen was titrated in a range of 6.25 pM–62.5 nM. Neg is the negative control and the cells were stained by neither antibody nor antigen. (A) Dose dependent binding of antigen to antibody-displaying cells. The X-axis indicates the fluorescence strength of FITC and Y-axis represents the fluorescence strength of PE. (B) Analysis of cell populations displaying antibodies with different affinities. The RBA for each antigen concentration was calculated and the data for both Ab-1 and Ab-2 are presented as antigen dose dependent binding curves.

