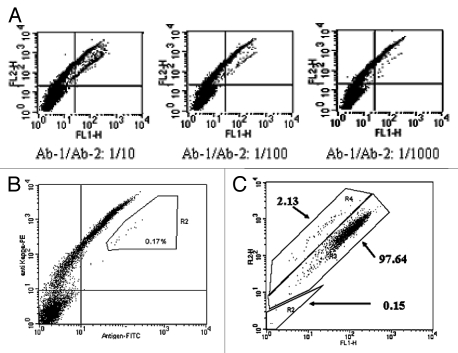
Figure 6.
Enrichment of cells displaying high affinity antibodies. (A) A mixture of cell populations displaying Ab-1 and Ab-2 were combined with parental untransfected Flp-In CHO cells at a ratio of 50:50. The ratios of Ab-1 and Ab-2 in final cell suspension were 1:10, 1:100 or 1:1,000 as indicated. The final cell mixtures were double stained by 100 nM of FITC-antigen and PE-anti-kappa chain antibody and then analyzed by flow cytometry. (B) 0.17% of the cells displaying Ab-1 were sorted from the mixture by FACS for expansion and re-analysis. (C) The sorted cells were re-analyzed by flow cytometry after 10 days expansion.

