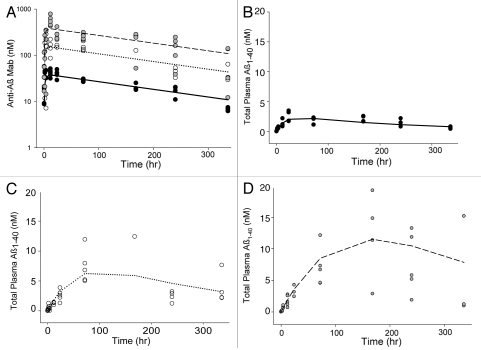
Figure 4.
Observed and model predicted antibody and ligand (Aβ1–40) levels obtained using the general equilibrium model to fit m266 PK and ligand data in the PDAPP mouse. Symbols represent individual animal data and lines are population means for doses of 0.5 (●, —), 2 (○, ⋯) and 5 (●, ---) mg/kg of antibody. Antibody concentrations are shown in (A) with total ligand concentrations following 0.5, 2 and 5 mg/kg m266 shown in (B–D) respectively.

