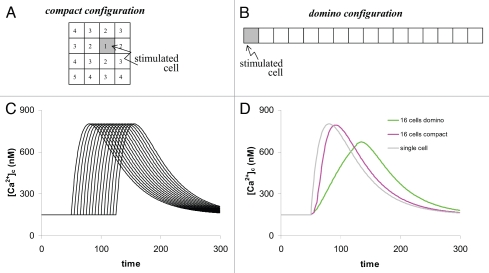
Figure 4.
The 16-cells system. (A) The compact system with stimulation in the middle. (B) The elongated system (domino configuration) with stimulation at one end. (C) [Ca2+]c-traces of all 16 cells in the domino configuration. (D) The over-all responses of the whole system in the ‘domino configuration’ (green) and in the compact configuration (pink). This trace is almost the same as in the 4-cell system as shown in Figure 3C. For comparison the response of a single cell is shown (gray line). This is identical with a whole systems response when all cells are simultaneously stimulated.

