
Figure 5.
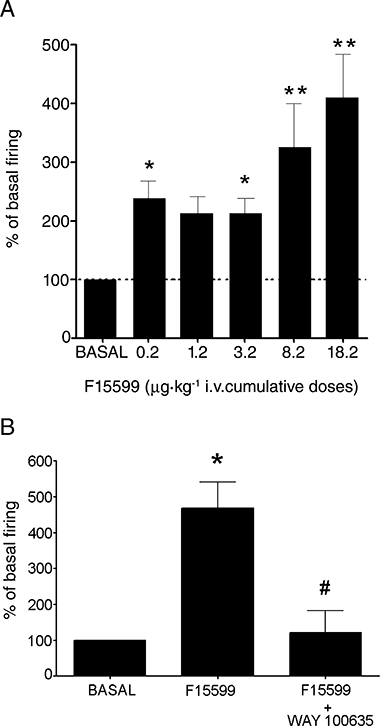
(A) Histogram showing the excitatory effect produced by F15599 on the firing rate of mPFC pyramidal neurones. Data correspond to neurones in the two experiments conducted (see text) which are 22, 20, 10, 7, 6 and 5 neurones for baseline, 0.2, 1.2, 3.2, 8.2 and 18.2 µg·kg−1 i.v. F15599 (cumulative doses) respectively. (B) Histogram showing the reversal by the 5-HT1A receptor antagonist WAY-100635 of the maximal excitatory effect of F15599 on mPFC pyramidal neurones (n= 4). *P < 0.05 vs. baseline; **P < 0.001 vs. baseline; #P < 0.02 vs. maximal effect of F15599; Newman–Keuls test post-anova.