
Figure 2.
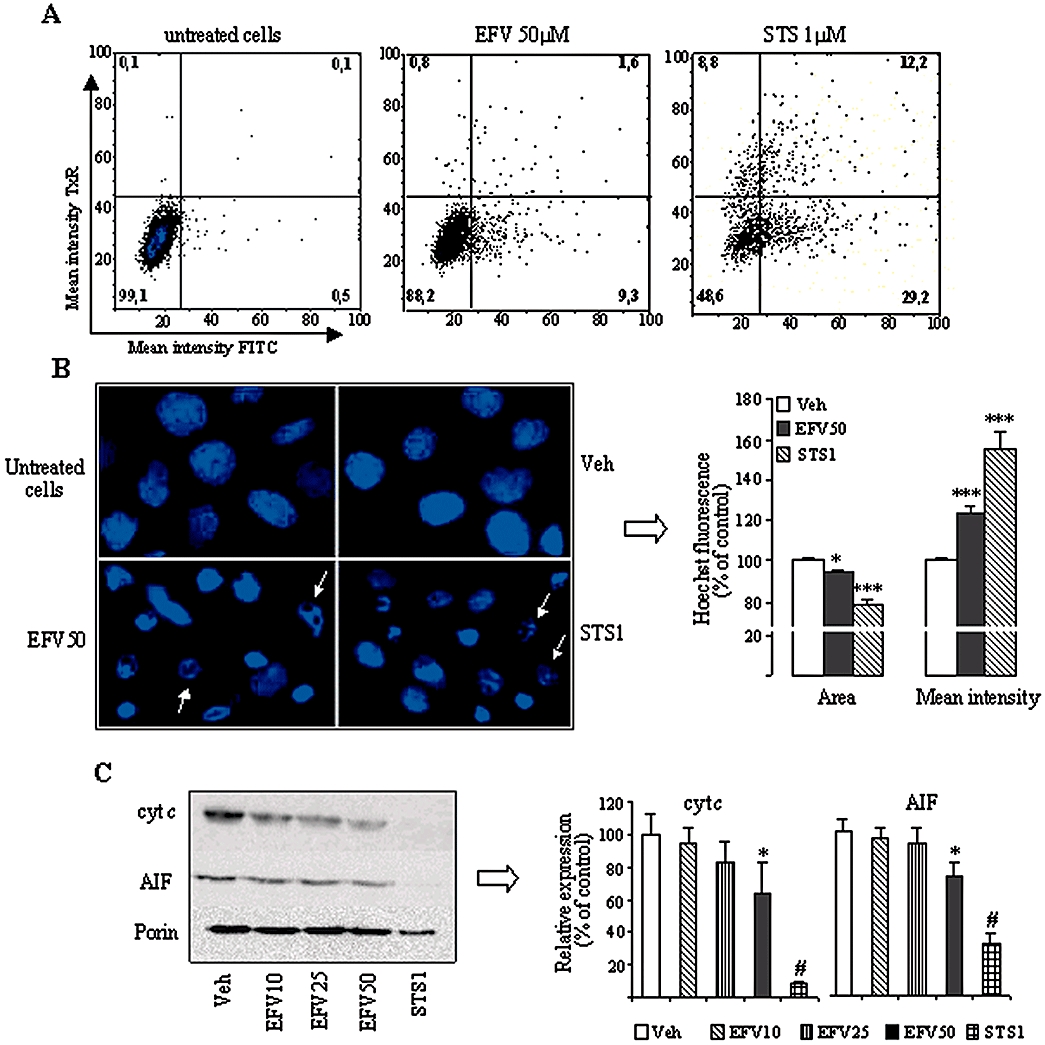
Activation of apoptosis in Hep3B cells after 24 h treatment with Efavirenz (EFV). (A) Representative histograms (Bivariate Annexin V/PI analysis) of untreated control cells, and cells treated with 50 µM EFV and 1 µM STS, showing the existence of 4 cellular populations: AnnV-/PI-, AnnV+/PI-, AnnV-/PI+ and AnnV+/PI+ (% of each population for all three conditions is provided) (B) Nuclear morphology by Hoechst staining. Left panel: representative fluorescence microscopy images (40x). Arrows show typically apoptotic nuclei. Right panel: summary of the Hoechst fluorescence data, calculated as % of control (untreated cells) fluorescence, which was considered 100%. (C) Western blot analysis using mitochondria-enriched cellular fractions. Representative WB image and histogram expressing quantification of protein expression. Quantification was performed by densitometry and the results (mean ± SEM, n= 4–9) are expressed as protein expression in relation to that of untreated cells in each individual experiment, which was considered 100%. Statistical analysis was performed by one-way anova multiple comparison test followed by Newman–Keuls test (*P < 0.05, ***P < 0.001 vs. vehicle). The positive control was independently analysed by Student's t-test (# P < 0.001).