
Figure 3.
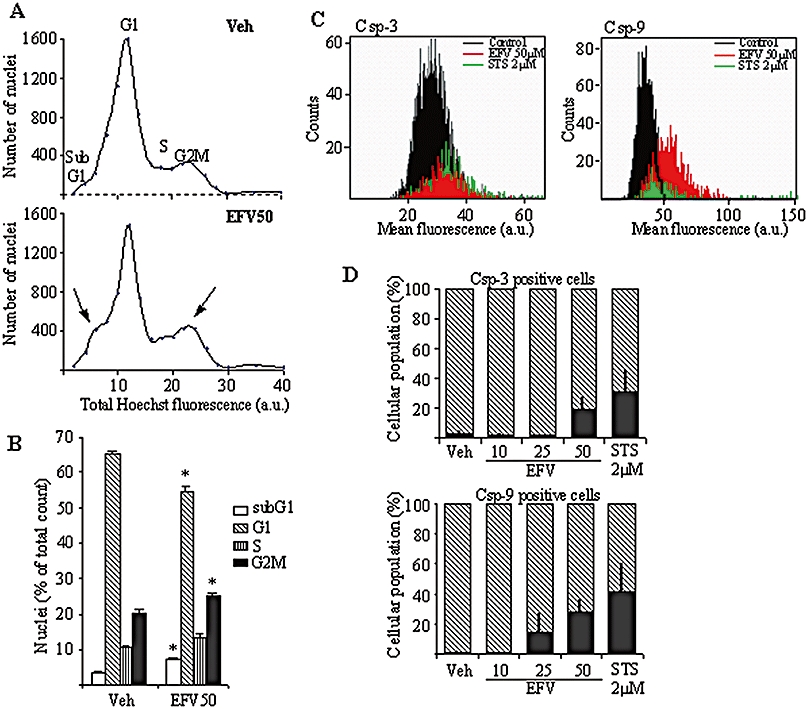
Cell cycle analysis by static cytometry (Hoechst fluorescence) in Hep3B cells treated with vehicle or Efavirenz (EFV) 50 µM for 24 h. Representative cytograms (A) and a summary histogram (B) are shown; statistical analysis was performed by one-way anova multiple comparison test followed by Newman–Keuls test (*P < 0.05 vs. vehicle). (C,D) Analysis of caspase-3 and -9 activation by static cytometry in Hep3B cells treated for 24 h with increasing concentrations of EFV, using 2 µM STS treatment as a control. Representative cytograms (C) show caspase-3 and caspase-9 activation detected as mean fluorescence. The histograms (D) summarize the fluorescence data and represent the % of positive cells in the total cellular population (shaded area). Data shown as mean ± SEM (n= 3–6).