
Figure 4.
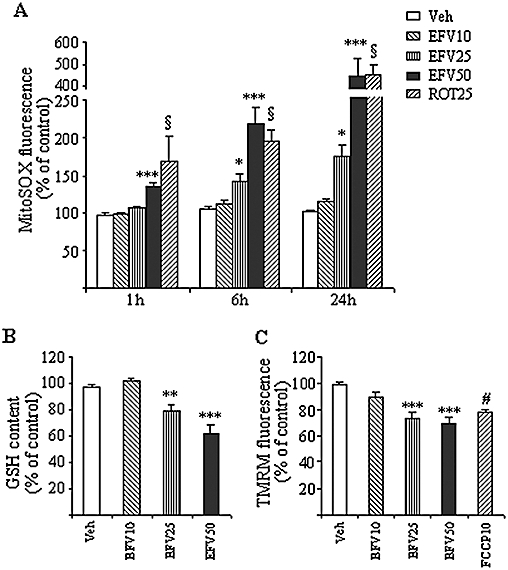
Effect of Efavirenz (EFV) treatment on mitochondrial redox state. (A) Superoxide production. MitoSOX fluorescence in Hep3B cells treated with increasing concentrations of EFV and vehicle for 1, 6 and 24 h using rotenone 25 µM as a positive control. (B) GSH concentration. The histogram shows the relative intracellular GSH levels (previously normalized to the cell number) in Hep3B cells treated with EFV for 4 h. (C) Mitochondrial membrane potential. TMRM fluorescence in Hep3B cells treated with increasing concentrations of EFV for 1 h, using 10 mM FCCP as a positive control. Data (mean ± SEM, n= 7–11) were calculated as % of control fluorescence value (untreated cells) and analysed by one-way anova multiple comparison test followed by Newman–Keuls test (*P < 0.05, **P < 0.01, ***P < 0.001 vs. vehicle). Data for rotenone and FCCP were independently analysed by Student's t-test, § or #P < 0.001.