
Figure 5.
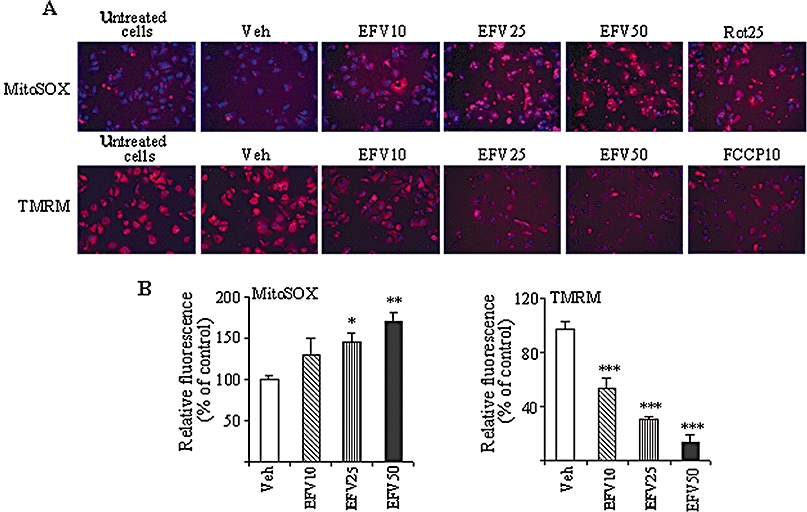
Effect of Efavirenz (EFV) treatment (1 h) on primary human hepatocytes. Rotenone 25 µM or FCCP 10 µM were used as positive controls. (A) Representative images of mitochondrial superoxide production, detected as MitoSOX fluorescence (upper panel: MitoSOX fluorescence in red, Hoechst-stained nuclei shown in blue), and Δψm, detected as TMRM fluorescence (lower panel: TMRM fluorescence in red, Hoechst-stained nuclei shown in blue). (B) Histograms summarizing MitoSOX fluorescence (left panel) and TMRM fluorescence (right panel). Data (mean ± SEM, n= 3–6), calculated as % of control (untreated cells) fluorescence value were analysed by one-way anova multiple comparison test followed by Newman–Keuls test. *P < 0.05, **P < 0.01, ***P < 0.001 versus vehicle.