
Figure 7.
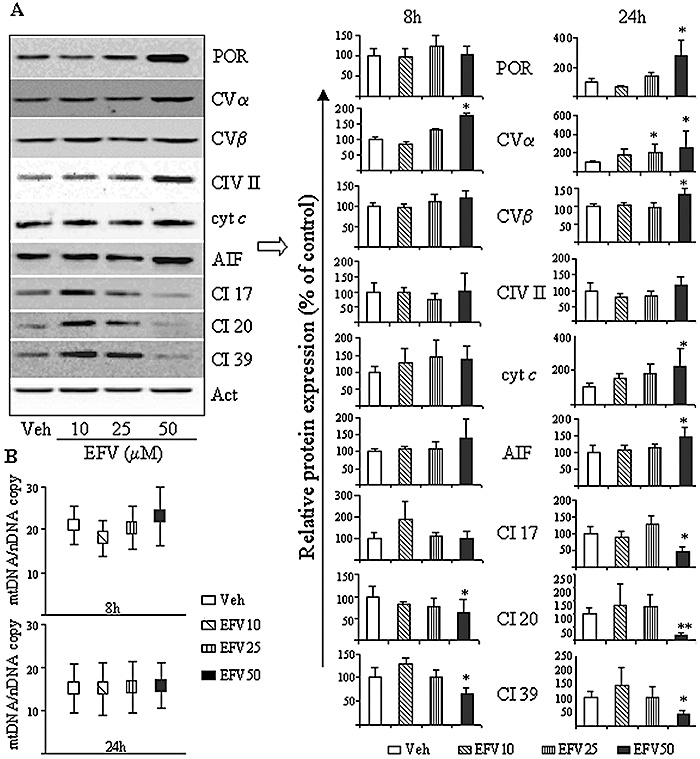
Effect of Efavirenz (EFV) treatment on mitochondrial protein expression. Hep3B cells were treated with increasing EFV concentrations for 8 and 24 h. (A) Representative WB image (24 h) and histograms expressing quantification of the expression of various proteins (8 and 24 h) are shown. Comparisons were made with the protein expression in control (untreated) cells, which was given a relative value of 100% in each individual experiment. Data (mean ± SEM, n= 3–7) were analysed by one-way anova multiple comparison test followed by Newman–Keuls test, *P < 0.05 and **P < 0.01 versus vehicle. (B) Quantitative genomic PCRs used to quantify the relative ratio of mtDNA/nDNA, data represented as mean ± SEM, n= 3–7.