
Figure 8.
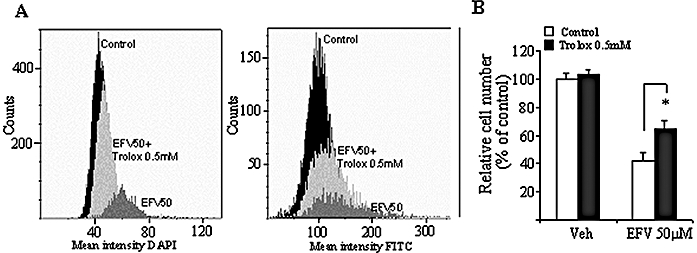
Effect of the antioxidant Trolox on Efavirenz (EFV) 50 µM-treated Hep3B cells. (A) Representative cytograms of untreated control, EFV 50 µM-treated cells and cells treated with EFV 50 µM + 0.5 mM Trolox, showing mean 4′,6-diamino-2-phenylindole (DAPI) (Hoechst) fluorescence (left panel) and mean fluorescein isothiocyanate (FITC) (10-N-nonyl-acridine orange chloride) fluorescence (right panel). (B) Histogram of cell number analysed by static cytometry. Data (mean ± SEM, n= 3–5) were analysed by Student's unpaired t-test, *P < 0.05 versus vehicle.