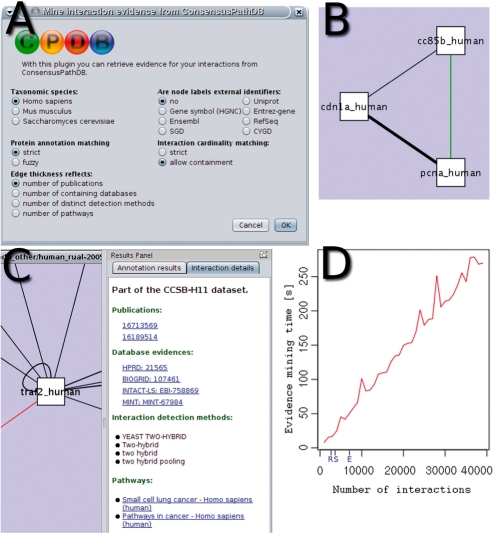
Fig. 1.
(A) The splash screen of the plugin showing the different parameters; (B) the ConsensusPathDB visual style where reproduced interactions are weighted by evidence and novel interactions are highlighted in green; (C) newly imported attributes of a selected interaction are shown in the ‘Interaction details’ tab of Cytoscape's results panel; (D) evidence mining time plot for networks of different size with default parameters (here, all query interactions were present in ConsensusPathDB such that the mining process took maximal time). The sizes of the networks predicted using large-scale interaction screening by Rual et al. (2005) (R), Stelzl et al. (2005) (S) and Ewing et al. (2006) (E) are marked on the x-axis.

