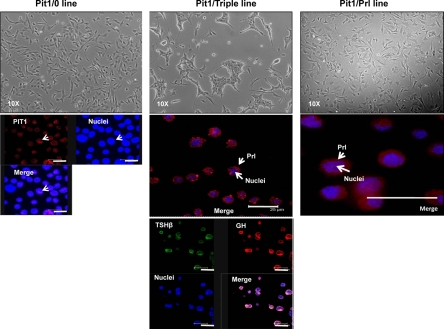
Figure 4.
Phase contrast and immunofluorescence analyses of the three Tag-transformed cell lines confirm distinct cell morphology and hormone expression profiles. Phase photomicrographs of the three cell lines are shown in the top three panels and immunofluorescence studies in the lower panels. The Pit1/0 and Pit1/Prl lines have a similar single-cell appearance (upper right and upper left panels, respectively), whereas the Pit1/Triple line displays a strong tendency to form cell clusters (center top panel). Pit-1 protein was detected within the nuclei of all cells in each of the three lines (the Pit1/0 line shown here and data not shown). The coexpression of Prl, GH, and TSHβ in all Pit1/Triple cells is demonstrated by the immunofluorescence study (center middle and lower panels); all cells are positive for all three hormones. The merge frame in this study combines the signals from the GH and TSHβ staining. The Pit1/Prl cell line is positive for Prl, consistent with the RNA analysis. Bars in the immunofluorescence images, 25 μm.

