Figure 6.
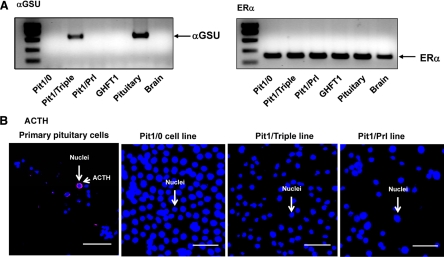
Analysis for expression of additional factors in newly established cell lines. A, RT-PCR assessment for αGSU and ERα. RNA samples from each of the three new cell lines were assessed by RT/PCR for αGSU and ERα mRNA expression in parallel with the GHFT1 line and mRNA isolated from mouse pituitary and brain of a wild-type mouse. Positive and negative controls (adult mouse pituitary and liver, respectively) demonstrated the expected expression patterns. These data reveal that αGSU is selectively expressed in the Pit1/Triple line. This finding is consistent with the expression of the Tshβ mRNA in this line. ERα was found to be ubiquitously expressed in all cell lines and tissues analyzed. B, Immunofluorescence assessment for ACTH. Analysis of disaggregated primary pituitary cells demonstrates corticotrope (cytoplasmic ACTH staining) cells, whereas the parallel analysis of the three cell lines fails to reveal evidence ACTH expression.

