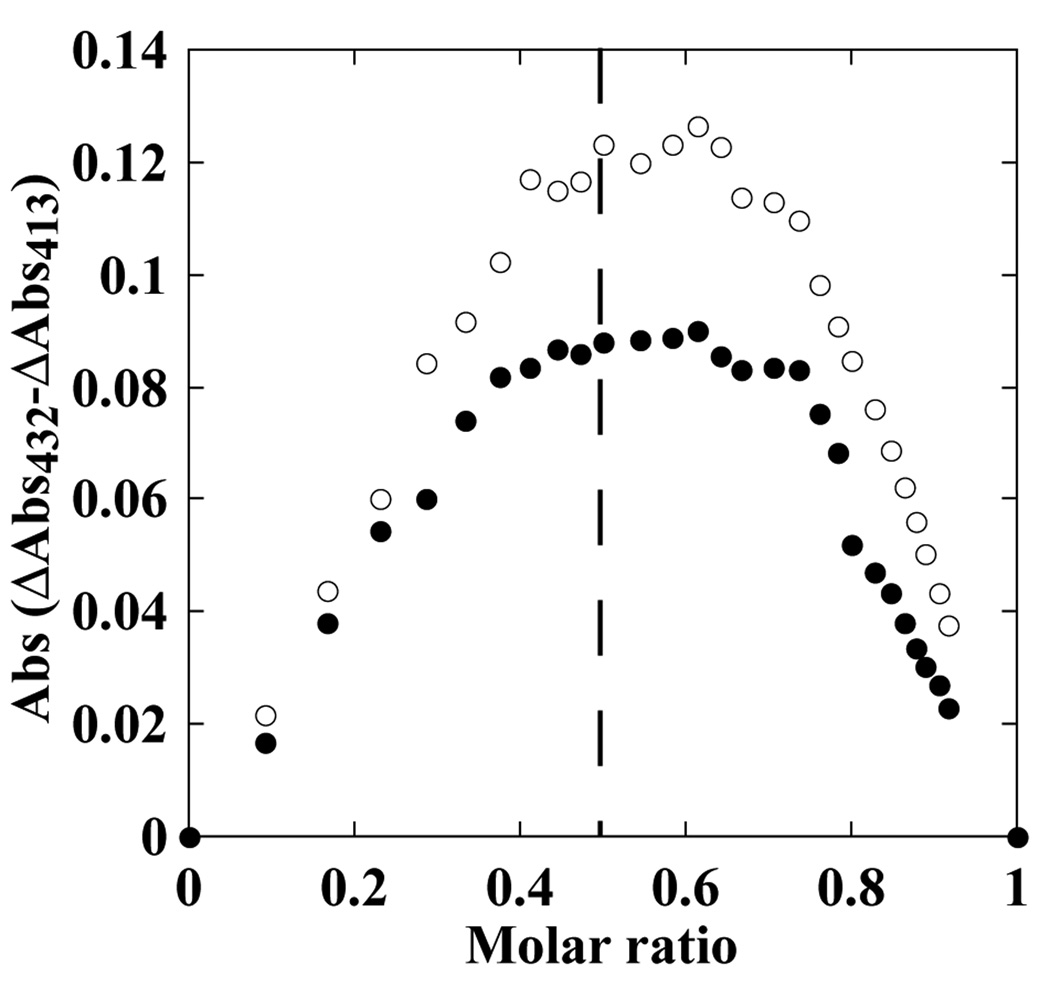
Fig. 2. Stoichiometry of CYP130-inhibitor binding.
The bell-shaped Job plots at a total protein and inhibitor concentration of 15 µM display a maximum close to a mole fraction of 0.55, the value that corresponds to a 1:1 ratio for the binding to CYP130 of econazole (open circles) and miconazole (closed circles).

