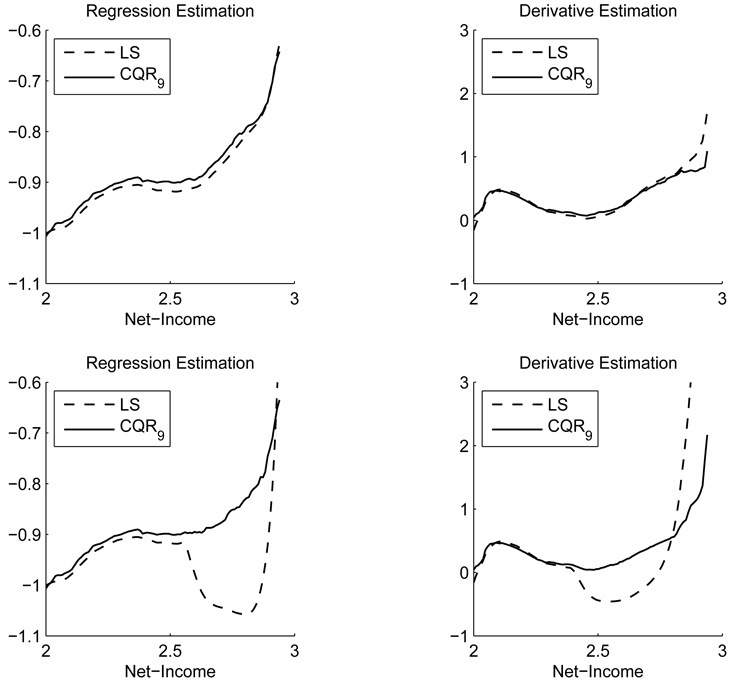
Figure 2.
Plot of estimated regression function and its derivative. The top panel is for the estimate removing the two possible outliers, and bottom panel is for the estimate moving the two possible outliers to more extreme cases. The left panel is for the estimated regression function, and the right panel is the estimated derivative function.

