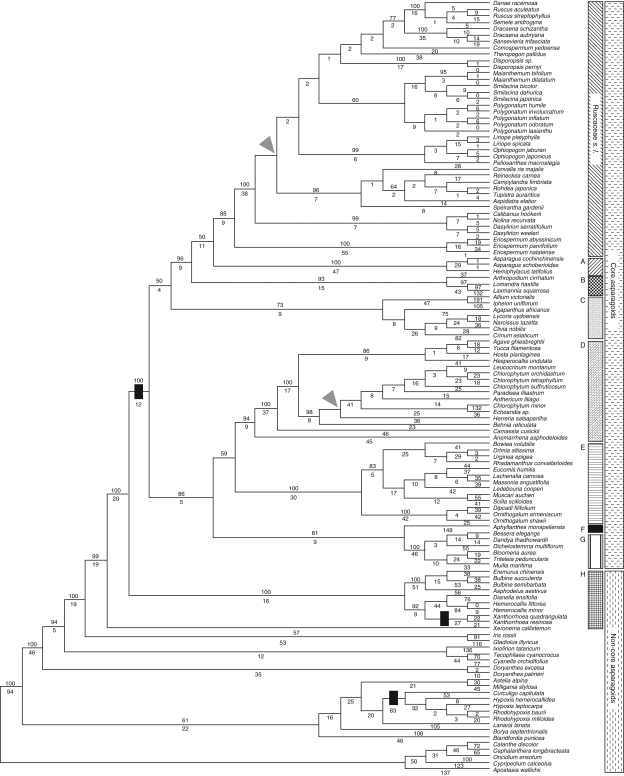
Fig. 2.
One MP tree from combined DNA data (analysis B) for 121 taxa of Asparagales. Numbers of substitutions are indicated below each branch, and bootstrap percentages >50 % are given above each branch. Triangles indicate groups not present in the strict consensus tree of the Fitch analysis. Bars show points at which changes in microsporogenesis have taken place. Tree length is 6442 steps with CI = 0·71 and RI = 0·85. A, Asparagaceae; B, Laxmanniaceae; C, Alliaceae s.l.; D, Agavaceae s.l.; E, Hyacinthaceae; F, Aphyllanthaceae; G, Themidaceae; H, Xanthorrhoeaceae s.l.

