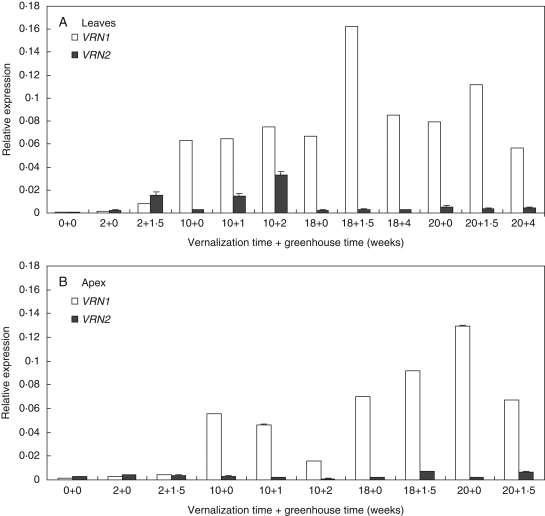
Fig. 5.
Quantitative real-time PCR expression analysis of putative VRN1 and VRN2 orthologues, as compared with Actin transcript levels, in (A) leaves and (B) apex of timothy plants during vernalization for 0, 2, 10, 18 and 20 weeks in a growth chamber and after 1–4 weeks of growth in a greenhouse. Data are the means ± s.e of three replicate samples.

