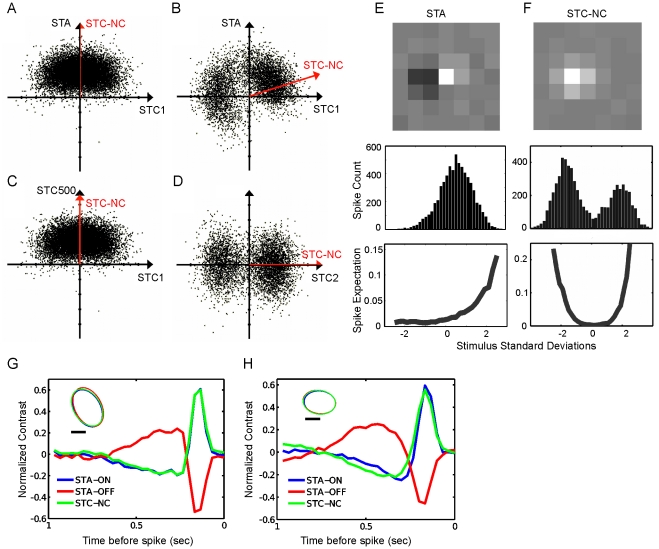
Figure 2. The linear filter discovered by non-centered spike triggered covariance (STC-NC) analysis aligns with the STA for ON or OFF cells and the high variance STC for ON-OFF cells.
(A–B) Scatter plots of the STE projected onto the STA and the high variance STC (STC1) for an ON cell (A) and an ON-OFF cell (B) shows that the STC-NC aligned extremely well with the STA for the ON cell, but not for the ON-OFF cell, in which the STC-NC clocks toward the STC1. The STA was projected out of the STE prior to computing the STC only in A–B to ensure that the STA was orthogonal to the discovered STC vectors. (C) Scatter plot of the STE against the high and low variance STC vectors for the same cell in (A). The STC-NC aligned better with the STA in panel A than the low variance STC (STC500). (D) Scatter plot of the STE against the two STC vectors of greatest variance for the same cell in (B). The STC-NC aligned extremely well with the STC of highest variance. The length of the STC-NC vector (red) corresponded to the degree to which it projects onto the 2D plane. (E–F) Spatial frame of maximal contrast, 1D projection of the STE, and recovered static nonlinearity using the STA (E) and STC-NC (F, STC-NC bias = −0.11) for the ON-OFF cell from (B) and (D). The STA misidentified this cell as an ON cell and provided a poorly defined RF. (G–H) Some ON-OFF cells possessed spatiotemporally overlapping and inverted ON and OFF RFs (G), and some possessed slower OFF RF filters (H). The STC-NC accurately captured the character of both the ON and OFF filters for the cell in panel G, but not in panel H. The insets show the spatial RF centers (Scale bar: 100 µm).

