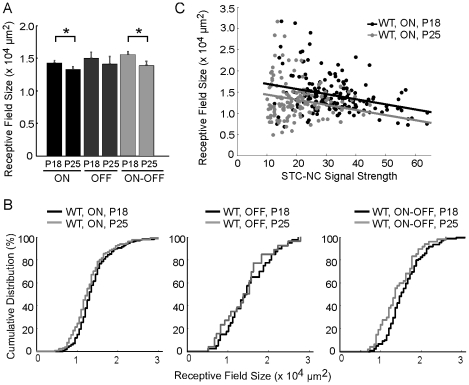
Figure 7. STC-NC analysis measures a reduction in the RF center size for both ON and ON-OFF cells during WT development.
(A) Both ON and ON-OFF RGCs show a decrease in RF center size at P25 compared to P18, while the size of OFF RGC RF centers is unchanged. (B) Cumulative distributions of RF center sizes for ON, OFF, and ON-OFF cells in WT. *: p<0.05; ***: p<0.001 in Wilcoxon rank sum test (same in Fig. 8). (C) The correlation between the STC-NC signal strength and RF size is negative for WT P18 (black) and P25 (gray) ON cells. The ANCOVA technique removes the effect of the confounding STC-NC signal strength prior to calculating the significance of differences in RF size due to grouping. The parallel lines represent best fits. Following standard ANCOVA analysis, the parallel condition was enforced after demonstrating that the slopes of the lines of best fit through the two data sets were not significantly different and that P25 had smaller RF sizes than P18 for WT ON cells ( p = 4×10⁻⁵ in ANCOVA test).

