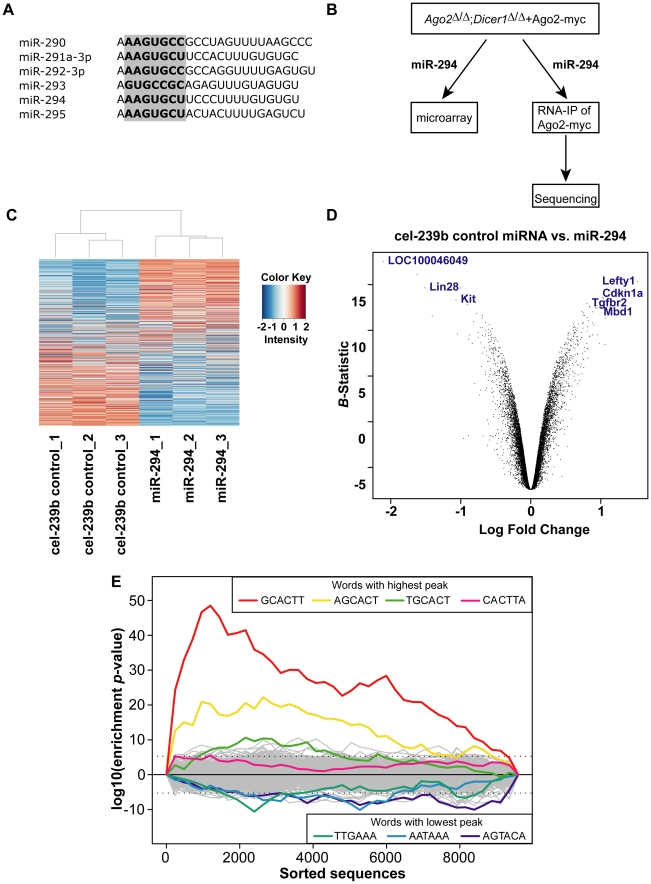
Figure 1. Microarray analysis of Dicer1-null ES cells transfected with miR-294.
(A) Sequences of predominantly expressed mature miRNAs from the miR-290-295 cluster with their seed sequence highlighted in bold. (B) Experimental scheme to identify miR-294 targets: miR-294 was transfected into Ago2 Δ/Δ;Dicer1 Δ/Δ ES cells transgenic for Ago2-myc; the transcriptome profile was analysed by microarray; and miR-294-programmed Ago2-myc was subjected to RNA-immunoprecipitation and deep sequencing of the bound mRNA. (C) Heatmap showing differentially expressed genes between miR-294-transfected and cel-239b-transfected ES cells. The heat map was colour coded using red for downregulation and blue for upregulation (with respect to the mean signal in all the six samples). (D) Volcano plot to set threshold for differentially expressed genes. A negative log Fold Change on the x-axis corresponds to upregulated genes in miR-294 transfected cells whereas, a positive log Fold Change corresponds to downregulated genes in miR-294 transfected cells. (E) Overrepresentation of miR-294 seed matches in the most downregulated genes of the microarray. The motif-discovery tool Sylamer was used. The x-axis represents the sorted gene list from most downregulated (left) to most upregulated (right). The y-axis shows the significance for each word.

