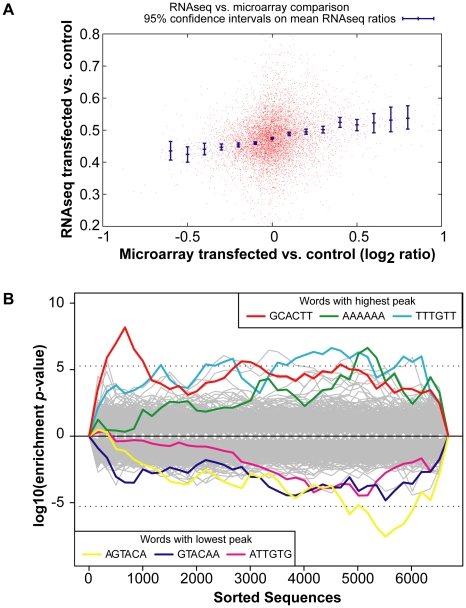
Figure 2. Global gene expression changes in the INPUT.
(A) RNA-Sequencing (RNA-Seq) of the INPUT (Total RNA) follows the microarray trend in gene expression. The y-axis represents the RNA-Seq ratio of the INPUT from Dicer1 Δ/Δ+Ago2-myc ES cells transfected with miR-294 vs. cel-239b. Higher values mean enriched in cel-239b vs. miR-294. The x-axis represents the fold change in gene expression as measured by microarray. A positive value indicates upregulation of genes in miR-294-transfected cells and a negative value indicates downregulation of genes in miR-294-transfected cells. (B) Overrepresentation of 6-mer (position 2-7) seed matches to miR-294 in the INPUT of Dicer1 Δ/Δ+Ago2-myc ES cells transfected with miR-294. The x-axis represents the sorted gene list from most downregulated (left) to most upregulated (right). The y-axes show the significance for each word.

