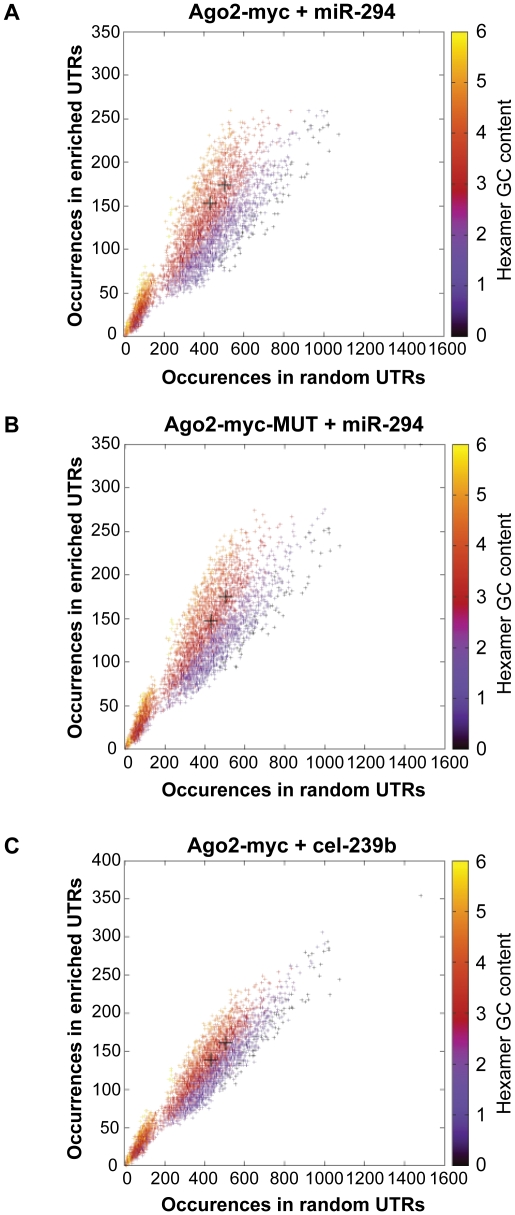
Figure 3. Hexamer composition of enriched 3′ UTRs.
Each point represents a hexamer and the color corresponds to its GC content. This plot compares the frequency of hexamers present in ≈500 top-enriched 3′ UTRs vs. ≈2000 non-enriched 3′ UTRs for (A) Ago2-myc transfected with miR-294 (B) Ago2-myc-MUT transfected with miR-294 (C) Ago2-myc transfected with cel-239b. The black crosses indicate the three hexamers contained within the miR-294 seed 8-mer.

