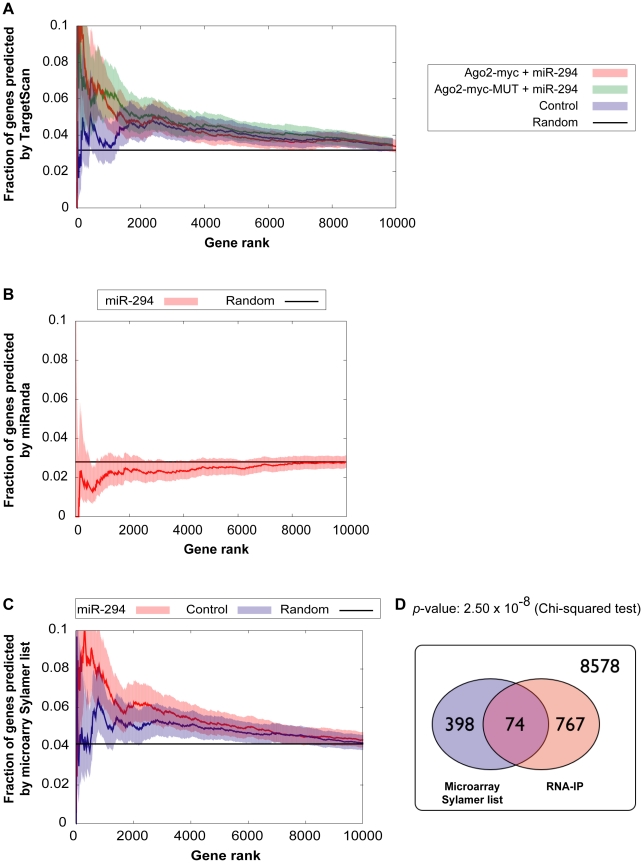
Figure 4. Comparison of genes enriched in the IP with computational and microarray predicted targets.
(A,B) Correlation between enriched genes in the IP and computational target predictions. The x-axes represent fraction of genes ranked by increasing p-value for the likelihood of enrichment in the IP. The y-axes represent the fraction of those genes, which have a (A) TargetScan prediction (B) miRanda prediction. Red indicates Ago2-myc samples transfected with miR-294; green indicates Ago2-myc-MUT samples transfected with miR-294; blue indicates samples transfected with cel-239b control miRNA. The black line shows the expected outcome if enrichment and target predictions are independent from one another. (C) Correlation between enriched genes in the IP and microarray target predictions (selected from the Sylamer-based cut-off). The x-axis represents the fraction of genes ranked by p-value for the likelihood of enrichment in the IP. The threshold for selecting enrichment was a p-value <0.003 from the binomial model. (D) Venn diagram overlap between Sylamer microarray target predictions and enriched genes in the IP. 8578 represents the number of genes which were considered (both microarray and RNA-IP data was available) but which were neither depleted on the array nor enriched in the IP.

