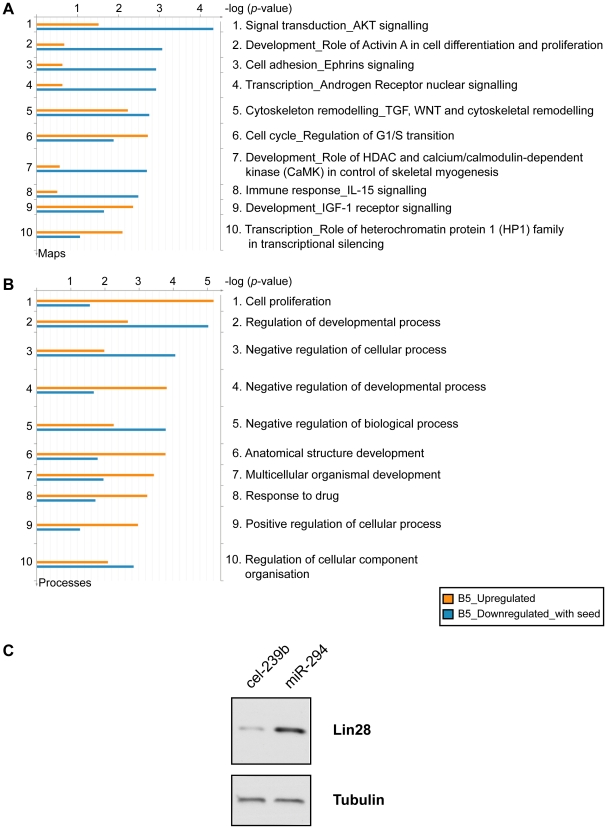
Figure 5. Functional enrichment of genes differentially expressed upon miR-294 transfection.
Genes identified with differential expression from the microarray analysis were assigned functions based on Gene Ontology (GO) annotations using the GeneGo tool (GeneGo Inc). Functional ontologies are represented by (A) GeneGo canonical pathway maps (B) GO processes. The top ten terms are shown for downregulated genes (B-statistic >5) with at least one 6-mer site in its 3′ UTR (orange) and upregulated genes (B-statistic >5) (blue). (C) Western blot of Lin28 expression in Dicer1 Δ/Δ+Ago2-myc ES cells transfected with cel-239b control miRNA or miR-294.

