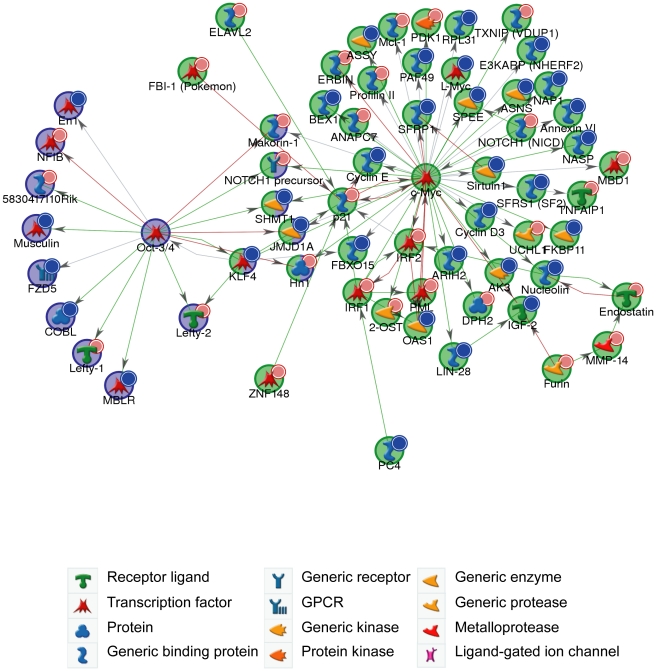
Figure 6. c-Myc and Oct-4 networks.
GeneGo network generated from microarray gene expression data. Downregulated genes (B-statistic >5) with at least one 6-mer site in its 3′ UTR are marked with red circles; upregulated (B-statistic >5) with blue circles. c-Myc network (p-value <1.70×10−130); Oct-4 network (p-value <8.20×10⁻³⁵). Green arrows indicate an activating effect; red arrows an inhibitory effect and grey is an unspecified effect.

