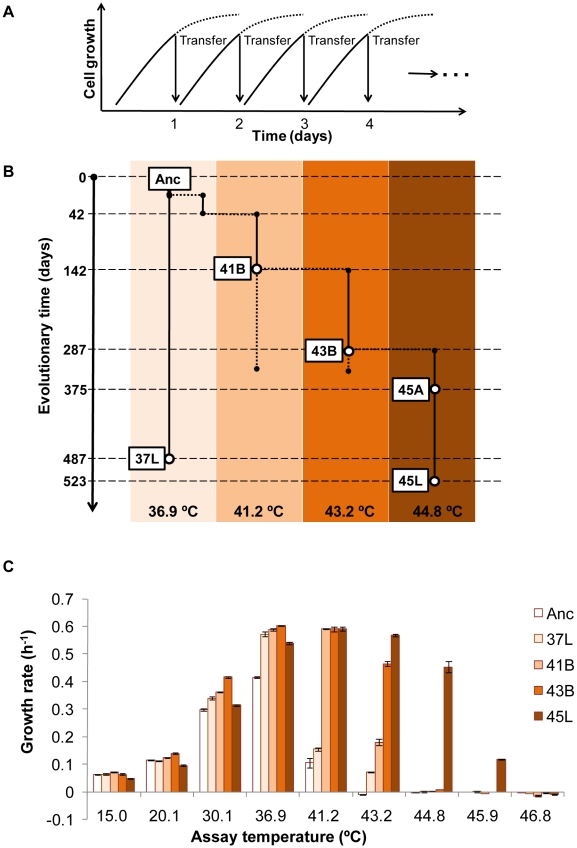
Figure 1. Thermal adaptive evolution.
(A) Culture conditions in the evolution experiment. Daily serial transfer of cell culture was performed at the exponential growth phase. Daily growth curves are indicated by the solid and dotted lines, and the arrows indicate the serial transfer points. Serial transfer was continued for about 2 years. The vertical axis (cell growth) indicates the cell concentration on a logarithmic scale. (B) Scheme of the entire evolution experiment. The phylogeny and nomenclature of the experimental lineages evolved under defined laboratory conditions at different temperatures, indicated as 36.9°C, 41.2°C, 43.2°C and 44.8°C. Anc, 37L and 45L represent the ancestor, the 36.9°C and 44.8°C evolved strains, respectively. 41B and 43B indicate the strains at branching (temperature increase) points at 41.2°C and 43.2°C, respectively. 45A indicates an intermediate strain of the serial transfer at 44.8°C. The vertical axis represents the long-term evolution timescale. (C) Thermal growth characteristics of the bacterial strains acquired from the evolution experiment. The cell populations 41B and 43B, 45L, 37L and Anc, were evaluated. The averaged growth rates (± SE, n = 5–6) for each strain at 15.0°C, 20.1°C, 30.1°C, 36.9°C, 41.2°C, 43.2°C, 44.8°C, 45.9°C and 46.8°C are indicated. Constant propagation was defined as growth rate higher than 0.1 h−1.

