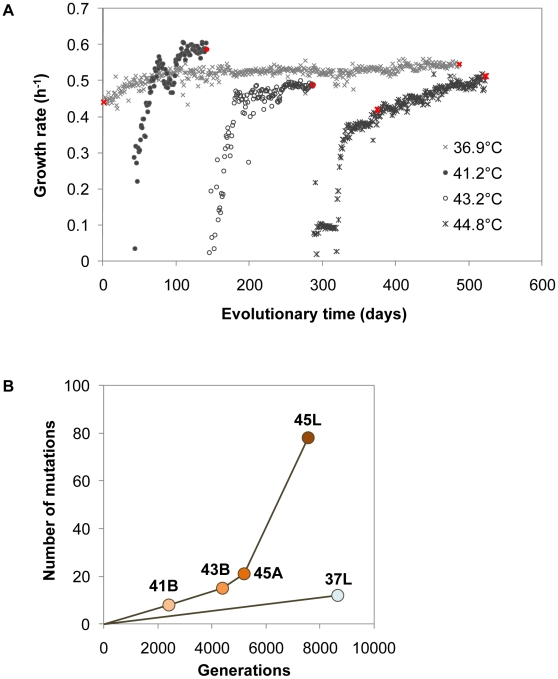
Figure 2. Fitness dynamics and genome mutations.
(A) Trajectories of growth fitness during evolution. Daily cell growth rates at various temperatures were calculated according to the absorbance at 600 nm, as described in the Methods section. Grey crosses, closed circles, open circles and asterisks indicate the growth rates of the bacterial cells at 36.9°C, 41.2°C, 43.2°C and 44.8°C, respectively. The highlighted (in red) cell populations (Anc, 37L, 41B, 43B, 45A and 45L, as indicated in Figure 1B) were subjected to genome sequence analysis. (B) Accumulated genome mutations. Genome mutations occurred in the evolved bacterial populations were detected by array-based resequencing and/or the Sanger method. Anc, 37L, 41B, 43B and 45L were subjected to resequencing array and Sanger sequencing. Mutations in 45A were detected by Sanger sequencing according to the mutations that occurred in 45L. The numbers of total mutations (including single-nucleotide substitutions, insertions and deletions) in 37L, 41B, 43B, 45A and 45L were plotted against the generation of each population experienced from the ancestral clone (Anc).

