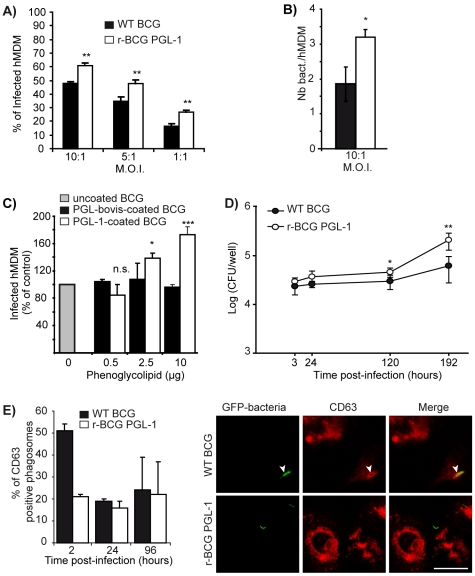
Figure 4. Effect of PGL-1 production on hMDM infection.
(A) Percentage of infected hMDM after 2 hours of contact with the mycobacterial strains at various MOI. (B) Number of bacteria per hMDM after 2 hours of contact with WT BCG or r-BCG PGL-1 at MOI 10∶1. (C) Percentage of infected macrophages following contact with uncoated WT BCG (grey bar), WT BCG coated with PGL from M. bovis (black bars) or with PGL-1 from M. leprae (white bars) at MOI 10∶1. 100% corresponds to 26% of infected macrophages. (D) Intracellular multiplication of WT BCG and r-BCG PGL-1 in hMDM. hMDM were infected for 2h at MOI 10∶1 and the number of cfus was evaluated at various time points by plating serial dilutions of cell lysates on mycobacterial solid medium. (E) Colocalization of WT BCG or r-BCG PGL-1 with CD63 at 2h, 24h and 96h post infection. Representative confocal microscopy images of WT or r-BCG PGL-1 phagosomes within CD63-immunostained macrophages at 2h post-infection. White arrows indicated a phagosome counted positive for CD63. Bar: 4µM. The percentage of phagosomes positive for each marker was calculated by counting 100 phagosomes from at least 10 different fields in duplicate. The values are means ± SEM of 4 independent experiments for panels A, and 2 independent experiments for panels B, C, D and E each performed in triplicate or duplicate for panel E. Black bars correspond to BCG control and white bars to r-BCG PGL-1. The significance of differences between BCG control and r-BCG PGL-1 was evaluated: *, p<0.05 ;**, p<0.01; ***, p<0.001; n.s., not significant.

