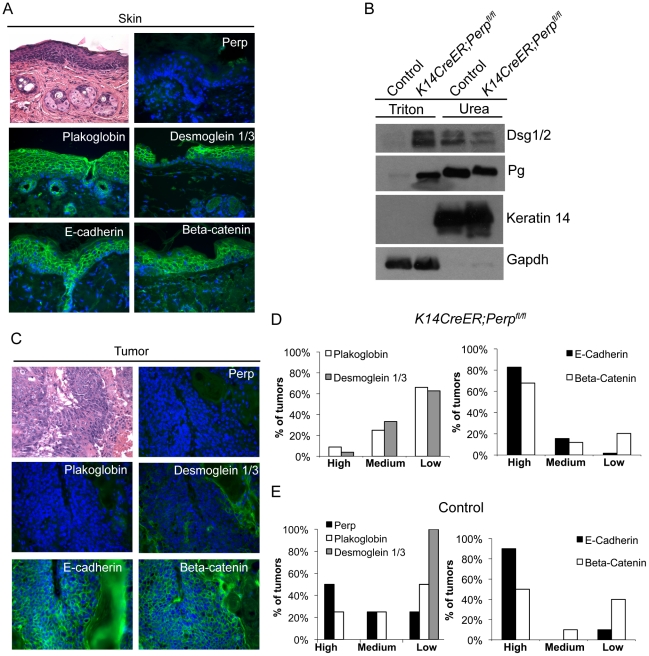
Figure 3. Adhesion junction analysis in tumors from K14CreER;Perpfl/fl and control mice.
A) Representative Hematoxylin and Eosin (H&E) staining and immunofluorescence images of desmosome and adherens junction component protein expression in skin from tamoxifen-treated K14CreER;Perpfl/fl mice demonstrating that Perp loss itself does not disrupt membrane expression of other adhesion proteins. B) Western blot analysis showing both the Triton X-100-soluble and urea-only soluble fractions of mouse epidermal lysates from control and K14CreER;Perpfl/fl mice. Desmoglein 1/2 (Dsg 1/2) and Plakoglobin (Pg) solubility were examined. Gapdh serves as a loading control for the Triton X-100-soluble pool, while Keratin 14 serves as the loading control for the urea fraction. C, D) Tumors from K14CreER;Perpfl/fl mice were stained with antibodies against various desmosomal and adherens junction components, and both the percentage of epithelial cells staining positive for each marker and the intensity of staining were measured. Staining for each antigen was categorized as high (>70%), medium (30–70%), or low (<30%) level expression. C) Representative H&E and immunofluorescence images of a K14CreER;Perpfl/fl tumor sample demonstrating desmosomal component loss with retention of adherens junction components. Green signal indicates antigen staining, and blue signal indicates DAPI-marked nuclei. D) (Left) Graph showing the percentages of K14CreER;Perpfl/fl tumors categorized into respective groups based on quantitative immunofluorescence staining for Plakoglobin and Desmoglein 1/3. (Right) Graph depicting the percentages of tumors categorized into respective groups based on immunofluorescence staining for E-cadherin and Beta-catenin. (E) Tumors from control wild-type mice were stained for desmosomal and adherens junction components, and each component was categorized as displaying high, medium, or low level expression, as described above. (Left) Graph showing the percentages of control tumors categorized into respective groups based on quantitative immunofluorescence staining for Perp, Plakoglobin, and Desmoglein 1/3. (Right) Graph depicting the percentages of tumors categorized into respective groups based on immunofluorescence staining for E-cadherin and Beta-catenin.

