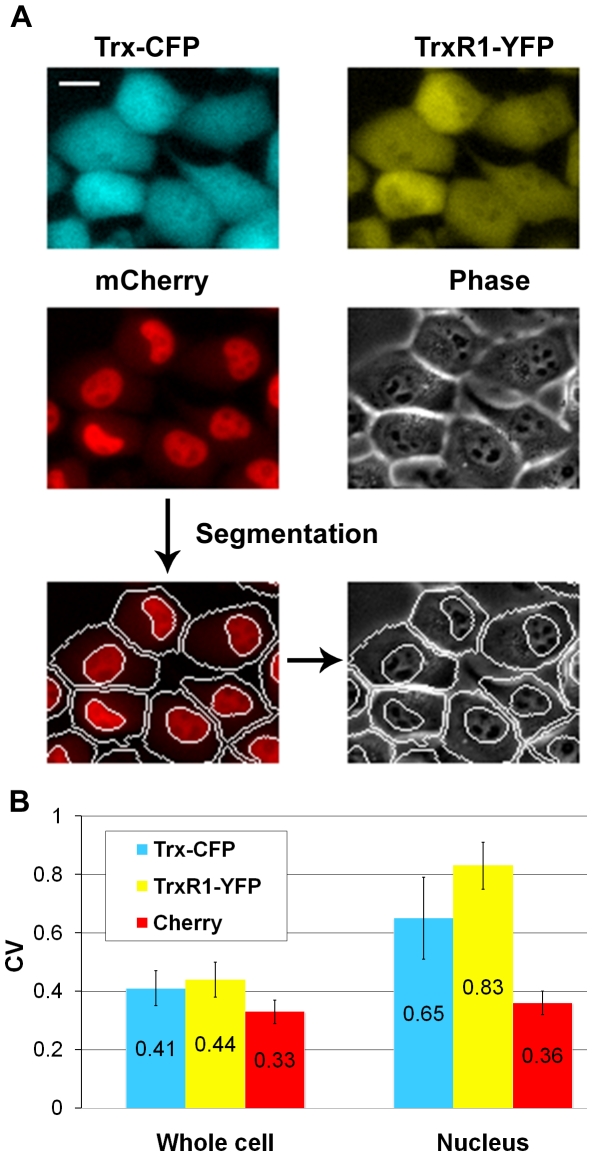
Figure 3. Individual cell measurements show high variability in nuclear levels of Trx-CFP and TrxR1-YFP.
A) Fluorescent and phase-contrast images of Trx-CFP/TrxR1-YFP reporter cells. mCherry fluorescence is used for automated detection of cellular and nuclear boundaries. Scale bar denotes 20 microns. B) The cell-to-cell variability in Trx-CFP and TrxR1-YFP nuclear levels is significantly higher than the variability observed for the whole cell protein content. The coefficient of variance (CV) represents the ratio between standard deviation and mean. Error bars denote standard error.

