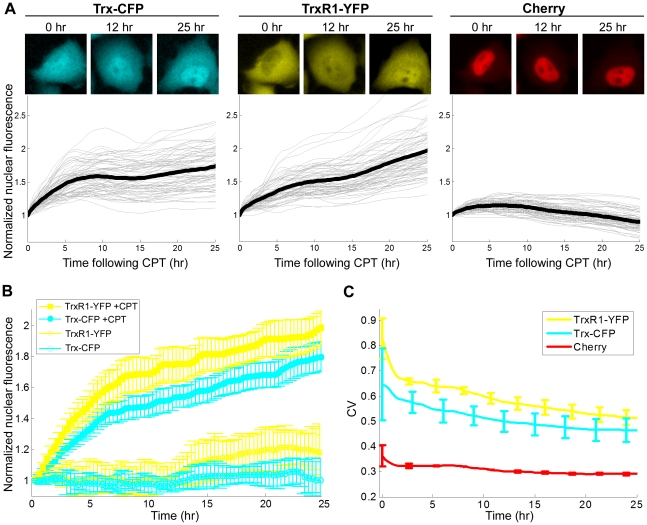
Figure 4. Nuclear accumulation of Trx-CFP and TrxR1-YFP in response to CPT.
A) Nuclear fluorescence profile of Trx-CFP, TrxR1-YFP and Cherry following CPT treatment. The upper panel shows fluorescent images of a representative cell expressing Trx-CFP and TrxR1-YFP. Time after CPT addition is indicated above each image. The lower panel: thin lines denote nuclear fluorescence of individual cells normalized to their initial nuclear fluorescence prior to the drug addition (time 0). Bold lines represent the normalized average nuclear fluorescence. B) Increase in nuclear fluorescence of Trx-CFP and TrxR1-YFP is caused by CPT. Yellow and cyan lines correspond to the normalized average nuclear fluorescence of TrxR1-YFP and Trx-CFP, respectively. Full and open circles denote nuclear fluorescence in CPT- and mock-treated cells, respectively. Error bars represent standard error of at least three independent experiments. C) Cell-to-cell variability in nuclear fluorescence of both Trx-CFP and TrxR1-YFP decreases upon CPT addition. CV of nuclear fluorescence of TrxR1-YFP (yellow line), Trx-CFP (cyan line) and Cherry (red line) was calculated for 25h following CPT addition. Error bars denote standard error.

