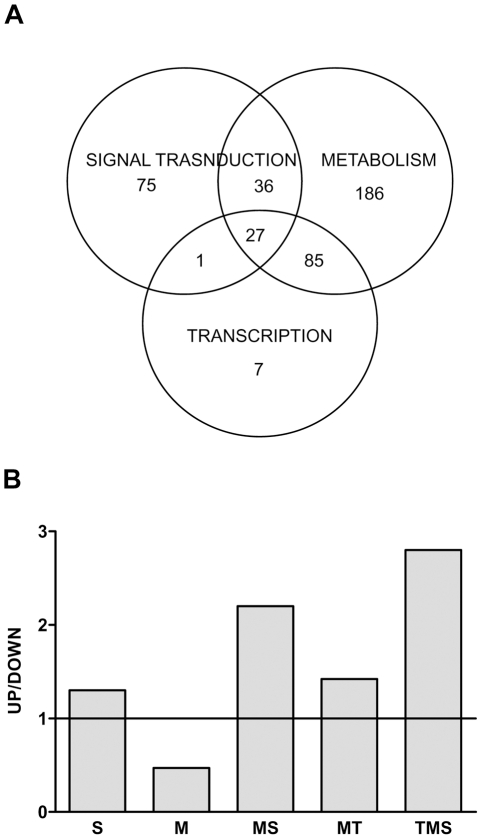
Figure 1. Functional classification (A) and global tendency of expression (B) of the genes differentially expressed in LP versus control rats.
(A) Venn diagram showing the number of genes classified into one single GO category as well as the number of genes exerting two or more biological functions. (B) A big proportion of the genes whose mRNA expression levels are affected by protein restriction during early life possess more than one function and exhibit a tendency for over-expression. S = signal transduction; M = metabolic process; T = transcription.

