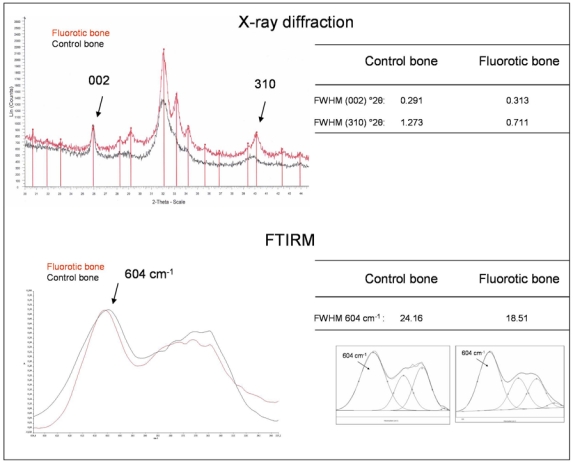
Figure 7.

Example of one pair of samples analyzed by X-ray diffraction (XRD) (fluorotic bone in red and control bone in black) and by FTIRM. XRD diagram shows the decrease of the full width at half maximum (FWHM) (°2θ) of the (310) reflection in fluorosis, while (002) reflection is unchanged. Regarding the overall aspect of XRD diagram of the two samples, fluorotic bone is more crystallized than control bone. FTIRM analysis shows a decrease of the FWHM of the 604 cm−1 (peak fitting inserted) of the fluorotic bone, indicating an increase in mineral crystallinity index.
