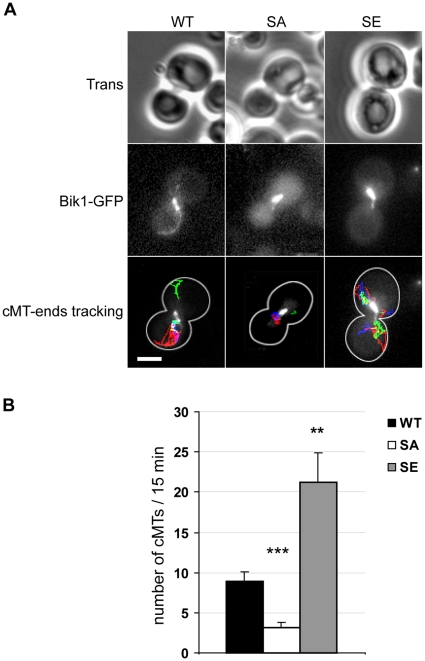
Figure 4. Nucleation and/or elongation activities of cMTs are modified in SA and SE cells.
WT, SA and SE cells were transformed with a plasmid expressing Bik1p-GFP, and were analyzed by time-lapse microscopy. (A) Representative WT, SA and SE pre-anaphase cells for which the plus-end of each cMT was tracked at each time point of the time-lapse experiment. Tracks are overlaid on an image of the movie. Scale bar, 3 µm. Movies are available in supplementary Figure S2. (B) The number of cMTs that appeared in 15 min in pre-anaphase cells was counted. Comparing to WT cells, this number was reduced in SA cells, but was greatly increased in SE cells. Number of analyzed cells: WT, n = 10; SA, n = 11; SE, n = 11; error bars are SEM. ** p<0.01, *** p<0.001, t test comparisons of mutant cells vs. WT cells.

