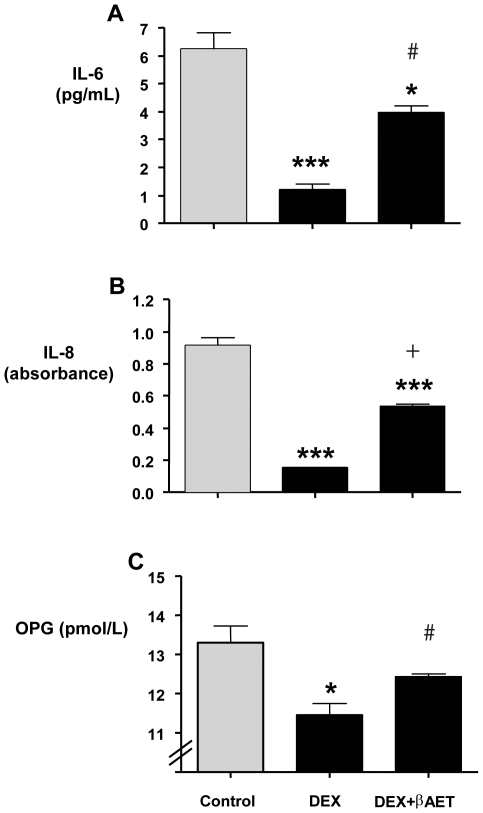
Figure 1. Effect of β-AET on GC-induced suppression of genes in MG-63 cell line.
MG-63 cells pre-treated (1 h) with β-AET were exposed to Dex for 8 hours. The expression of IL-6 (A), IL-8 (B) and OPG (C) was determined by ELISA in the culture medium. Significant differences from control (0.04% DMSO) are indicated as follows: *** = (p<0.001), ** = (p<0.05) and * = (p<0.01). # indicates a significant difference from Dex (p<0.05). + indicates strong trend (p<0.1). Data are expressed as means ± sem; n = 3. Absorbance values are plotted for IL-8 (panel B) because IL-8 concentrations extrapolated from standard curve in Dex only samples were below the limits of the standard curve and could not be reliably calculated.

