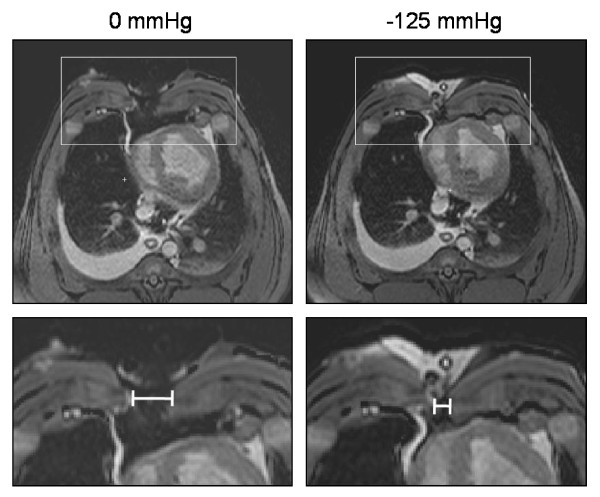
Figure 2.
Transverse magnetic resonance images at the cardiac midventricular level illustrating the wound contraction upon negative pressure wound therapy application. The images were obtained before (0 mmHg) and after the application of -125 mmHg. The lower panels are enlargements of the insets in the upper panels and illustrate the position of the measurements taken. Note how negative pressure wound therapy pulls the two sternotomy wound edges closer together.

