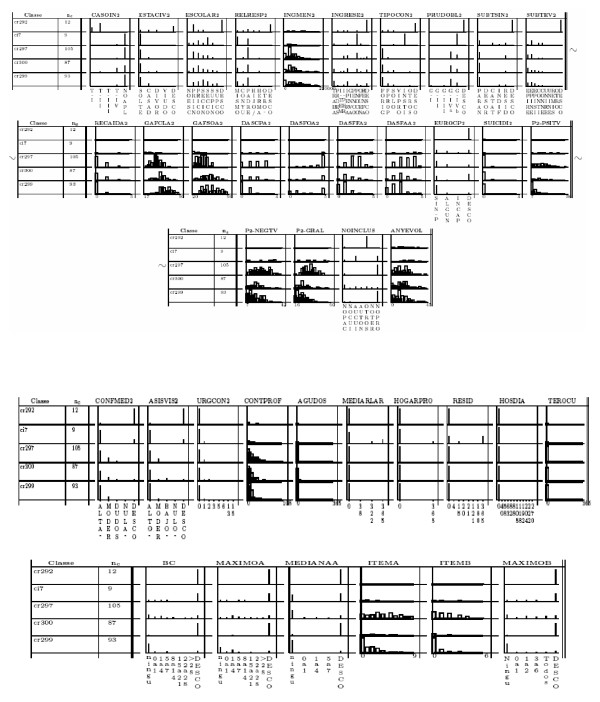
Figure 2.
Class panel graph. Every row shows one of the classes resulting from the ClBR process. In the columns, variables (relevant characteristics of the patients or items from the assessment scales) are presented. Every cell of the table shows the distribution of a given item or characteristic in a certain class This permits to identify wich variable have particular behaviour in which classes. Details of the interpretation iduced from these class panel graphs are presented in [12].

