Figure 5.
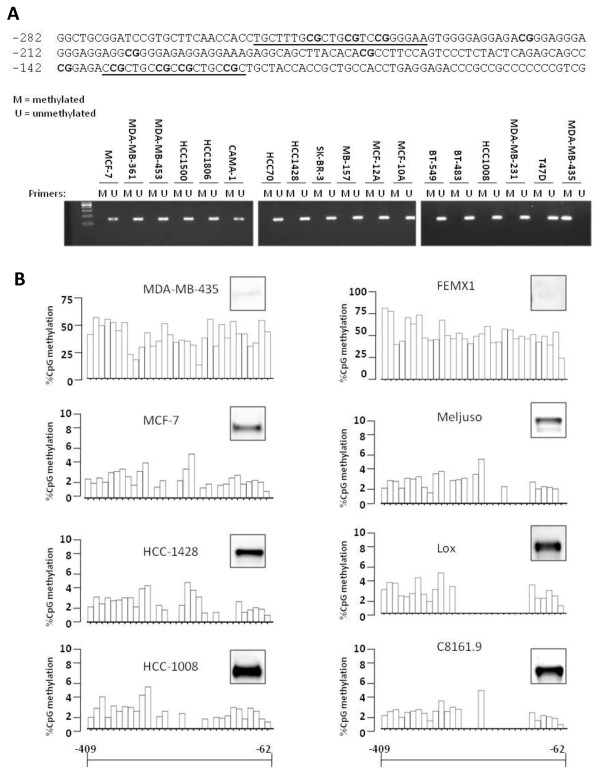
Promoter methylation regulates ALCAM expression in tumor cells. A) Sequence of the proximal ALCAM promoter showing multiple CpG islands (in bold) and methylation-specific primer targets (underlined). Ethidium bromide stained agarose gel showing PCR products for unmethylated (U) and methylated (M) genomic DNA. B) CpG methylation profile of the ALCAM promoter in the interval -62 and -409 relative to the cap site as determined by pyrosequencing for the indicated breast (MDA-MB-435, MCF-7, HCC-1428, HCC-1008) and melanoma (FEMX-1, MelJuso, LOX, C8161.9) tumor cells. ALCAM protein detected by western blot analysis is shown for each cell line. Note that the maximum value on the %CpG methylatyion axis (y) for the ALCAM-negative tumor cells MDA-MB-435 and FEMX1 are 75% and 100% respectively, and 10% for cells with endogenous ALCAM expression.

