
Figure 1.
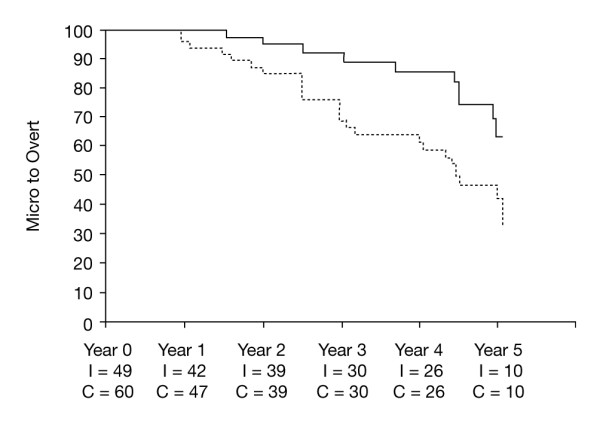
Kaplan-Meier curve showing progression from microalbuminuria (30-300 mg/24 hours) to overt albuminuria (>300 mg/24 hours) in patients with type 2 diabetes during conventional and intensive blood pressure lowering [46].
Official websites use .gov
A
.gov website belongs to an official
government organization in the United States.
Secure .gov websites use HTTPS
A lock (
) or https:// means you've safely
connected to the .gov website. Share sensitive
information only on official, secure websites.
Kaplan-Meier curve showing progression from microalbuminuria (30-300 mg/24 hours) to overt albuminuria (>300 mg/24 hours) in patients with type 2 diabetes during conventional and intensive blood pressure lowering [46].