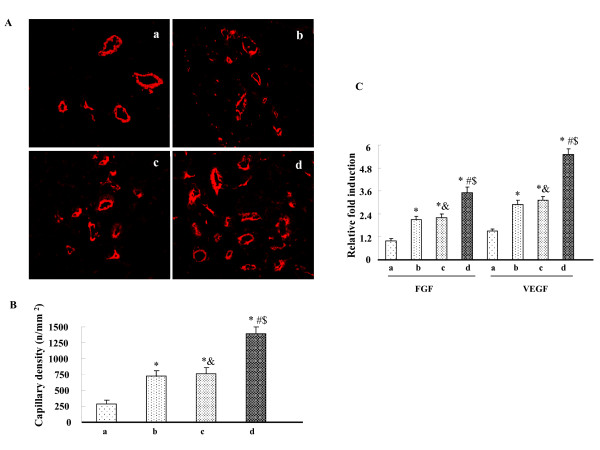
Figure 2.
Effects of HO-1-MSCs transplantation on neovascularization and angiogenic growth factors. (A) Representative microvessel in the border of infarcted myocardium 3 weeks after transplantation (200×). (B) Values are means ± SD of data from 6 separate experiments, * P < 0.05 compared with the hearts treated with PBS. # P < 0.05 compared with the hearts treated with Null-MSCs. &P > 0.05 compared with the hearts treated with Null-MSCs. $ P < 0.05 compared with the hearts treated with HO-1-MSCs and HO inhibitor. Lane a, hearts treated with PBS; Lane b, hearts treated with Null-MSCs; Lane c, hearts treated with HO-1-MSCs and HO inhibitor; Lane d, hearts treated with HO-1-MSCs. (C) Blots regarding the expression of FGF2, VEGF and actin were developed by the ECL method and relative protein levels were quantified by scanning densitometry and the relative gray value of protein = protein of interest/internal reference. Values are means ± SD of data from 6 separate experiments, * P < 0.05 compared with the hearts treated with PBS. # P < 0.05 compared with the hearts treated with Null-MSCs. &P > 0.05 compared with the hearts treated with Null-MSCs. $ P < 0.05 compared with the hearts treated with HO-1-MSCs and HO inhibitor. Lane a, hearts treated with PBS; Lane b, hearts treated with Null-MSCs; Lane c, hearts treated with HO-1-MSCs and HO inhibitor; Lane d, hearts treated with HO-1-MSCs.

