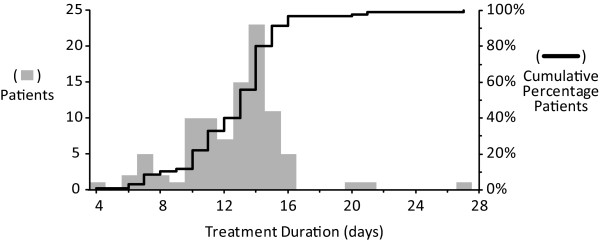
Figure 1.
Distribution of antibiotic treatment durations. The gray bars show the distribution of antibiotic treatment duration in days for the 95 study patients (left vertical axis). The black line represents the cumulative percentage of patients having completed treatment by a given duration (right vertical axis).

