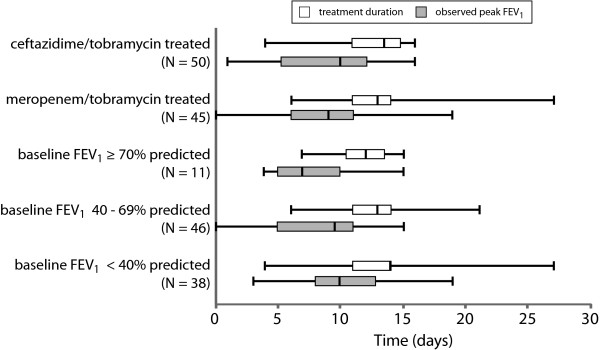
Figure 2.
Treatment duration and time to peak response by subgroups. Box and whisker plots of antibiotic treatment duration (white boxes) and time to peak observed FEV1 measure (gray boxes) among patients stratified by antibiotic treatment (ceftaz/tobra and mero/tobra) and by lung disease stage (FEV1 ≥ 70% predicted, 40- 69% predicted, and <40% predicted).

