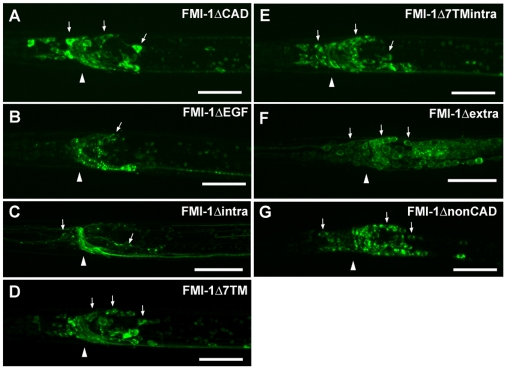
Fig. 7.
Localization of FMI-1 domain analysis constructs. (A-G) GFP images of head region with arrows indicating neuronal cell bodies and an arrowhead indicating the position of the nerve ring. Localization of construct (A) FMI-1ΔCAD, (B) FMI-1ΔEGF, (C) FMI-1Δintra, (D) FMI-1Δ7TM, (E) FMI-1Δ7TMintra, (F) FMI-1Δextra and (G) FMI-1ΔnonCAD in head region; lateral views, anterior towards the left. Scale bars: 10 μm.

