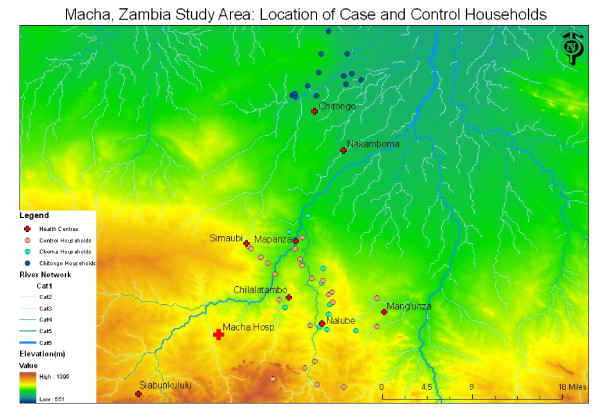
Figure 1.
Macha, Zambia Study Area: Location of Case and Control Homesteads. The map shows the elevation and major river systems of the Macha study region as derived from a digital elevation model. The rural health centres in the area are shown (red cross). The active case detection system focused on the Nalube, Chilalantambo, Mapanza, and Chitongo health centres. The location of the homesteads included in the active case detection system in the Choma (pink) and Namwala (blue) districts and the randomly selected control homesteads (green) are also shown.

