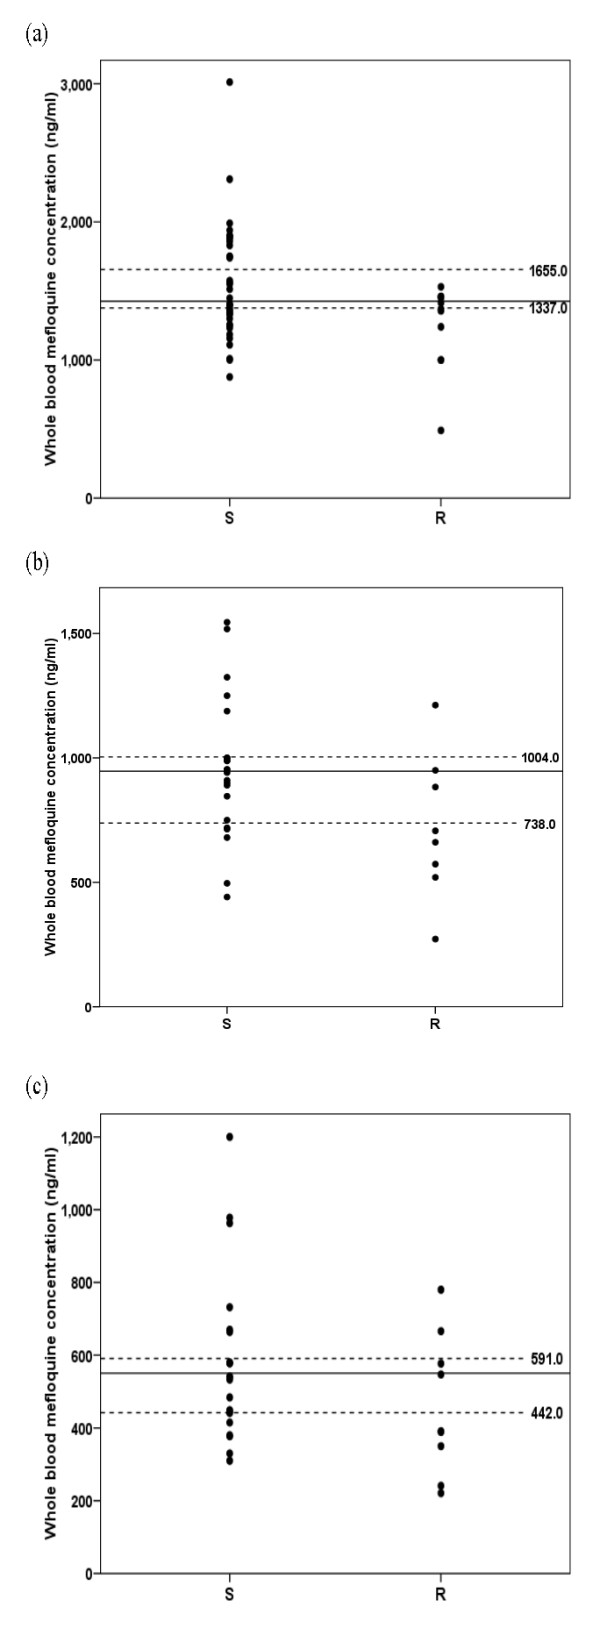
Figure 2.

Whole blood mefloquine concentrations on day 1 (a), day 7 (b) and day 14 (c) after treatment in patients with sensitive (S) and recrudescence (R) response. Dot lines represent the lower and upper level of 95% CI defined in the sensitive group.
