
Figure 3.
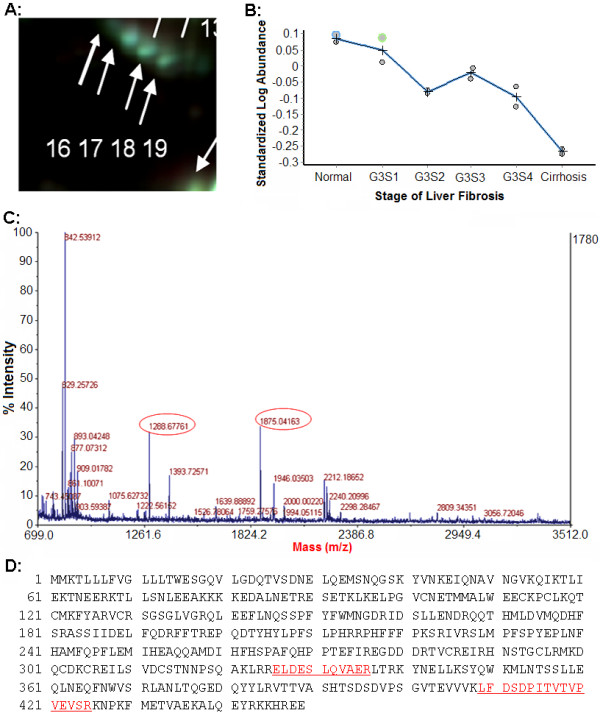
Plasma CLU levels were down regulated with fibrosis progress. A: Magnified region of DIGE gel image of CLU. B: The patterns of the relative abundance alterations of CLU in different groups. C: The MALDI-TOF MS map of CLU, in which peptide peaks for further MS/MS identification are labeled out with mass value. D: The amino acid sequences of CLU, in which MS/MS matched peptide sequences are underlined.