Figure 3.

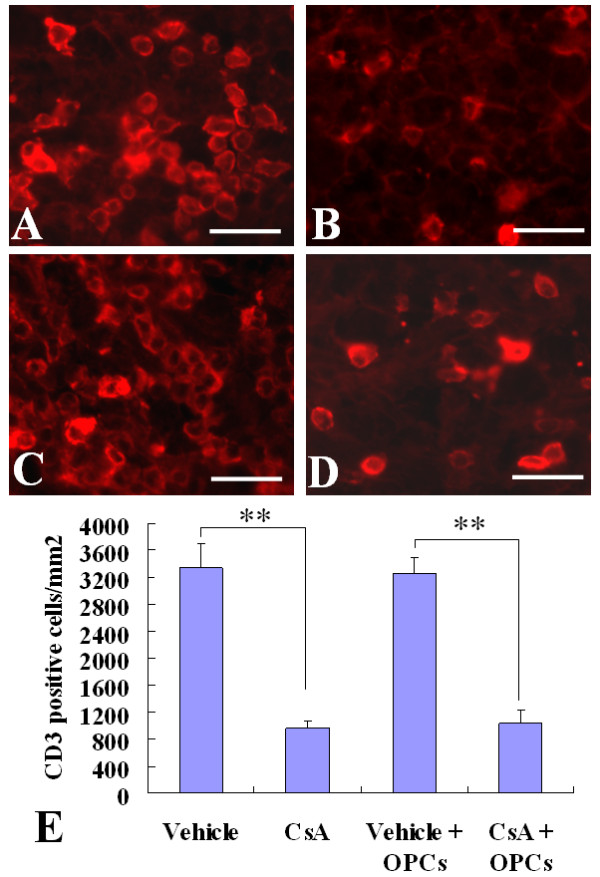
Infiltration of CD3+T cells in the injured spinal cords. Two weeks after cell transplantation, immunofluorescence labeling showed the CD3+ T cells in injured spinal cords. A~D: Representative pictures show CD3+ cells in the vehicle (A), CsA (B), GFP-OPC transplantation with vehicle (C) or with CsA (D) groups. E: The statistical results. Data are given as means ± SD, n = 6, ** p < 0.01 (ANOVA). Scale bar 20 μm.
