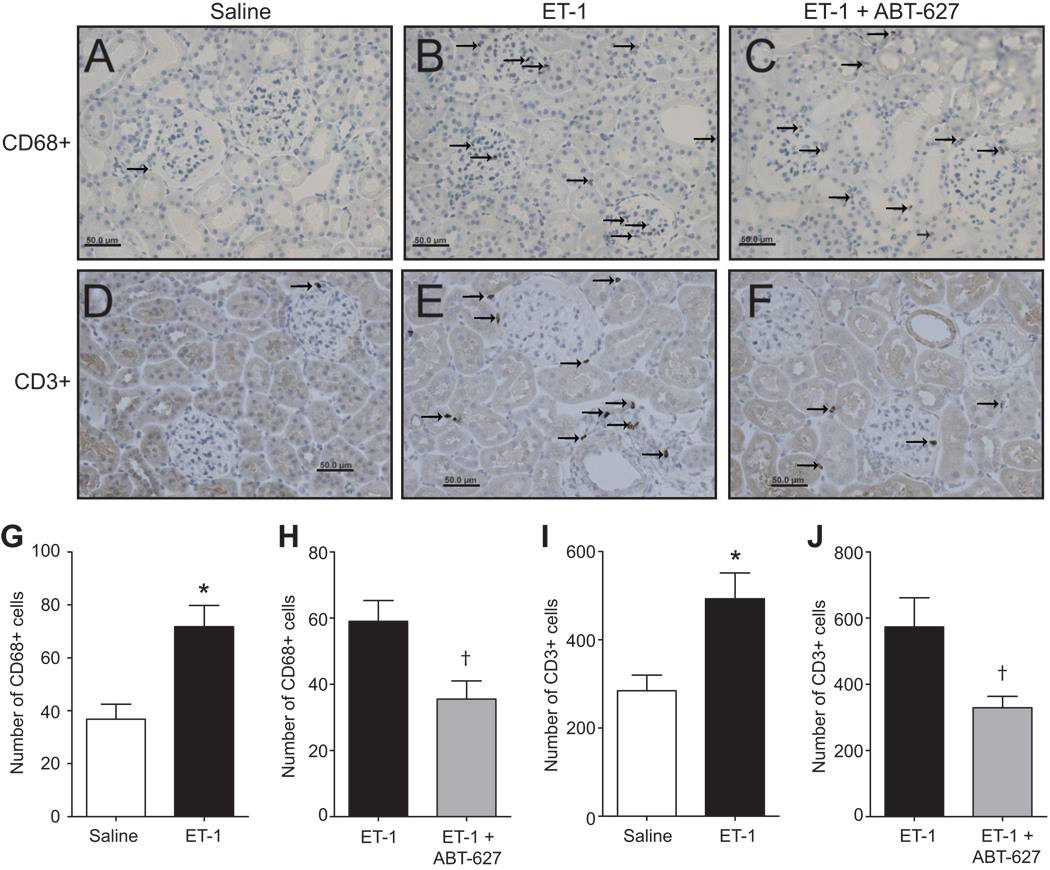
Figure 7.
Representative immunostaining images of kidney cortical sections isolated from rats treated with saline (A,D), ET-1 (B,E), or ET-1 plus ABT-627 (C,F) for 2 weeks. Sections were stained for CD68-positive cells (monocytes/macrophages) (A–C) or CD3-positive cells (T cells) (D–F). Numbers of CD68-positive cells are represented in panels G and H with CD3 positive cell counts in panels I and J (indicated by arrows). *P<0.05 versus saline and †P<0.05 versus ET-1 alone. n=4–5 rats/group.

